24 HOUR EMERGENCY RESPONSE: Call 0800 5999 009 or email info@humidityresponse.uk

Moisture mapping that shows what is wet, how far it has travelled and what needs to happen next

Water does not remain neatly around the point where a leak or flood first occurred. It can migrate beneath floor coverings, through screeds, along wall bases, into insulation, behind finishes and through adjoining rooms. A visual inspection alone can therefore underestimate the true extent of a water loss, while indiscriminate strip-out can remove materials that may not be affected.

Humidity Response uses systematic moisture measurement and mapping to create an evidence-based picture of the affected building fabric. Readings are taken across relevant walls, floors, ceilings and structural materials using instruments suited to the material and depth of investigation. The results can be recorded on drawings, photographs or digital moisture maps to show affected boundaries, comparative conditions and drying progress. This information supports leak investigations, insurance claims, drying design, strip-out decisions and final verification.

Why choose Humidity Response

Circle

Systematic rather than spot-check testing

Readings are taken in a pattern that allows the affected area to be followed and bounded rather than relying on a handful of isolated measurements.

Circle

Appropriate instruments for different materials

Non-invasive meters, pin/probe methods, concrete testing, relative-humidity measurements and thermal imaging can be combined where the construction requires it.

Circle

Reference and baseline readings

Suitable dry or unaffected areas can be used for comparison, helping distinguish elevated readings from normal material behaviour.

Circle

Digital documentation

Moisture readings can be transferred to plans or visual maps so clients and claims professionals can understand the extent without interpreting a list of numbers in isolation.

Circle

Drying progress can be tracked

Repeated measurements at consistent locations demonstrate whether materials are responding to the drying strategy and where further intervention may be required.

Circle

Clear completion evidence

End-point readings are assessed against appropriate dry standards, unaffected comparisons, material requirements and project objectives rather than an arbitrary single number for every material.

Our moisture-mapping process

1.

Define the loss and survey area

We establish the known or suspected source, incident date, affected rooms, construction type, finishes and any previous drying or strip-out. This defines where the mapping needs to begin and which materials require investigation.

2.

Establish suitable references

Where possible, readings are taken in unaffected or known-dry areas of similar material and construction. These reference points help establish the normal comparative range for the building and provide context for the affected readings.

3.

Survey systematically

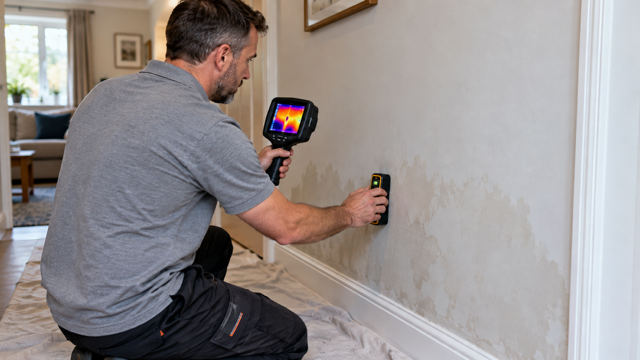
Floors, walls, ceilings and other relevant surfaces are scanned and measured in a structured pattern. The spacing and method are adjusted to the size of the loss, material type and the level of detail required.

4.

Investigate depth and construction where necessary

If surface measurements suggest trapped or deeper moisture, targeted pin probes, electrodes, in-situ relative-humidity measurements, thermal imaging or carefully selected intrusive checks may be used to understand the build-up rather than assuming the moisture is confined to the visible surface.

5.

Produce the moisture map and recommendations

Affected areas, readings, photographs and observations are documented. The map can support decisions on drying equipment, targeted removal, further leak detection, access or monitoring.

6.

Revisit and verify

On drying projects, repeat readings at consistent locations demonstrate the trend over time. Drying is concluded when the agreed evidence shows the affected materials have reached appropriate conditions for the project, not simply because the surface looks dry.

Technical information

Different moisture meters report different types of information. In timber, instruments may provide a percentage moisture-content reading. In many other building materials, non-invasive meters provide comparative or reference values rather than a universal percentage that can be interpreted in the same way across plaster, masonry, tile, roofing and screed. The technician therefore needs to select the correct scale, understand the material and compare readings intelligently.

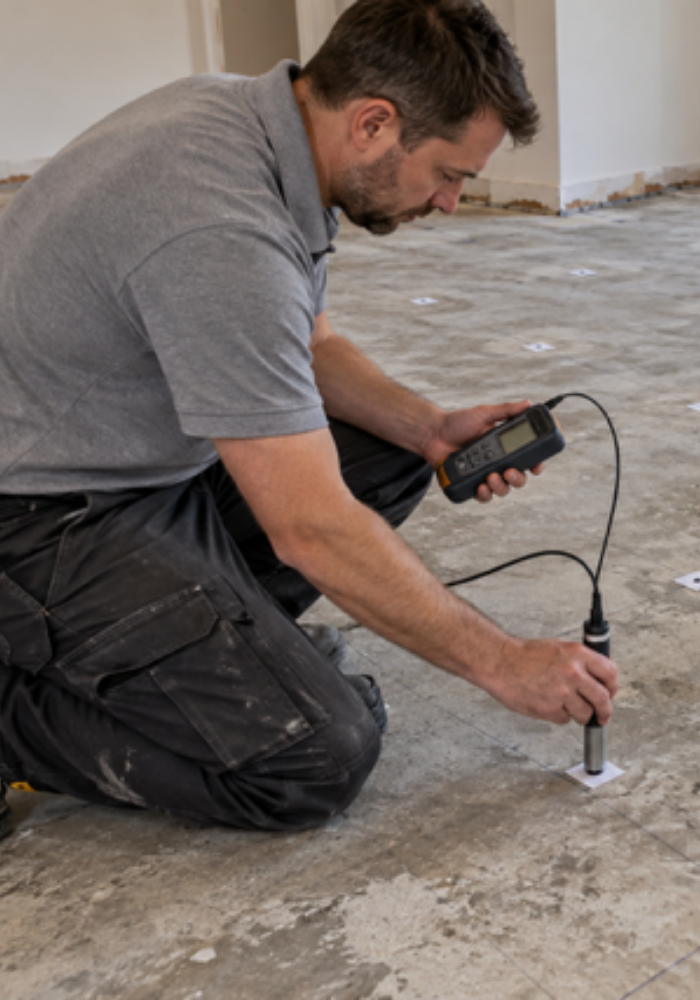
Professional Tramex instrumentation is well suited to this approach because non-destructive meters can rapidly scan large areas and readings can be recorded into digital moisture maps and reports. Depending on the construction, deeper investigation may use pin/probe methods or relative-humidity probes in materials and cavities. Concrete floors require particular care because surface readings alone may not describe the moisture condition deeper within the slab or screed.

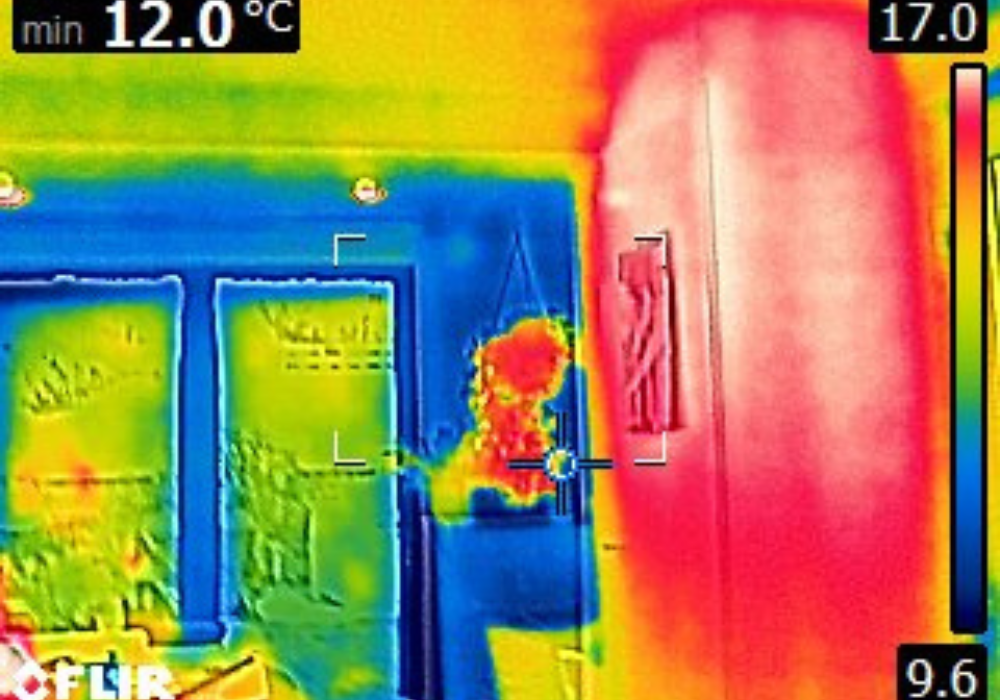
Thermal imaging can accelerate the mapping process by identifying temperature anomalies that deserve closer measurement, but it remains a screening tool. A cool thermal pattern may be associated with evaporative moisture, but it can also result from insulation, air movement or construction. The suspected area is therefore verified with moisture instruments before it is labelled as wet.

Moisture maps are especially valuable when they are repeated through a drying programme. They provide a visual record of the affected boundary reducing, stabilising or failing to improve. If one location remains elevated while surrounding areas dry, the pattern may indicate trapped moisture, an unaddressed source, poor airflow, a dense material or the need for a different drying technique.

The final dry standard is project- and material-specific. Affected readings may be compared with unaffected areas of the same construction, recognised material thresholds, in-situ relative-humidity criteria, floor-finish requirements or other agreed targets. Humidity Response records the basis used so the client can understand why drying is being continued or concluded.


Typical applications

  • Escape of water and flood damage assessments
  • Insurance claims requiring clear affected-area evidence
  • Post-strip-out surveys and drying design
  • Concrete, screed and floor-build-up investigations
  • Walls, ceilings and adjoining rooms where water migration is uncertain
  • Commercial buildings, schools and housing portfolios
  • Drying-progress monitoring and final verification
  • Supporting evidence during leak detection and Trace and Access

Frequently asked questions

What does a moisture map actually show?

It shows the locations and pattern of moisture readings across the surveyed surfaces, usually on a drawing, photograph or digital plan. This makes it easier to see which areas are elevated, where the affected boundary lies and how conditions change during drying.

Are moisture meters completely non-invasive?

Many of our initial measurements can be taken non-invasively. Where deeper or more specific information is required, pin probes, in-situ sensors or small targeted access points may be needed. We use the least disruptive method that can answer the technical question reliably.

Can a moisture meter tell you exactly where a leak is?

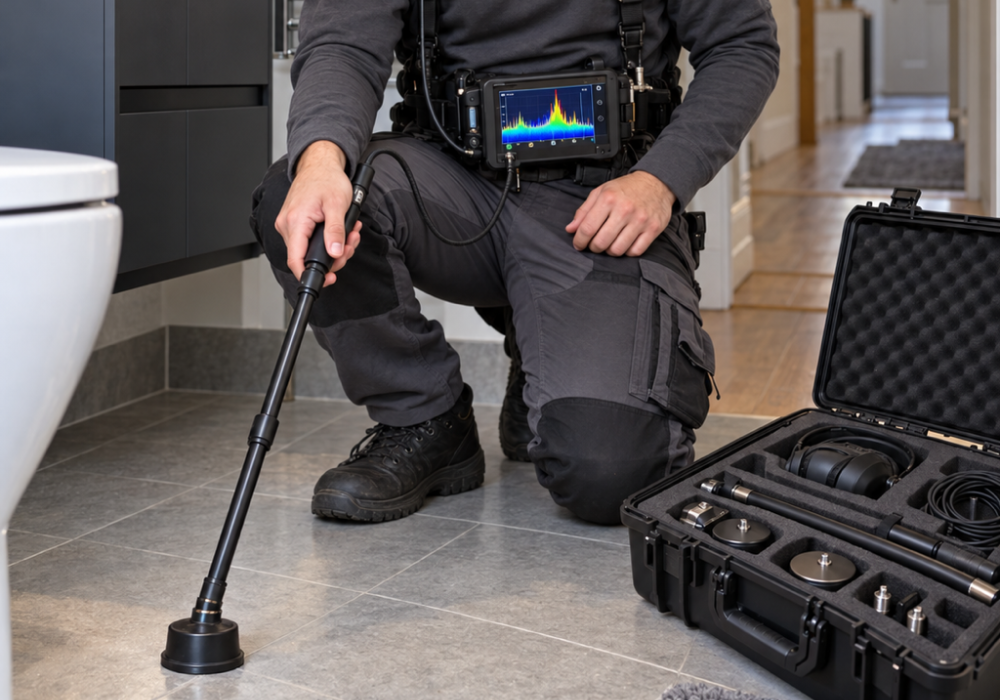
Moisture mapping can show the pattern of water migration and may help trace it back towards a source, but it is not always sufficient to pinpoint the defect itself. Leak detection may also require thermal imaging, acoustic testing, tracer gas or another method.

Why do you take readings in an unaffected area?

Building materials naturally vary. A suitable dry or unaffected comparison helps establish what is normal for that construction and gives context to the readings taken in the damaged area.

Can you monitor the map while a property is drying?

Yes. Repeat measurements at the same locations are one of the best ways to demonstrate drying progress. We can combine periodic moisture mapping with environmental or remote monitoring where the project requires more continuous data.

Will I receive a written report?

Where reporting is included in the instruction, we can provide photographs, mapped readings, observations, affected areas and recommendations. The level of detail can be tailored for homeowners, property managers, insurers, loss adjusters or commercial clients.

Accreditations, Memberships and Professional Training

01_pqs
02_cqms
ICO_Logo_Blue
OnceForAll_-_Full_colour_RGB-scaled
05_safecontractor
06_ssip_smas_existing_website
07_builders_profile
08_citb
09_bdma_existing_website
10_iicrc_existing_website
11_pmii
Screenshot 2026-10-12 at 20.21.30
13. Dewpoint Tech Logo OCT26
14_trading_standards_checked
15_nasc_existing_website
15_nasc_scalable_alternative
16_cscs
17_bwca_small_icon